
In civil engineering, understanding soil behaviour is crucial for designing stable and safe structures. Every foundation, retaining wall, embankment, or pavement ultimately rests on or interacts with soil. Since soil is a natural and heterogeneous material, its engineering behaviour varies significantly depending on its composition and structure.
The soil phase diagram is a fundamental tool that helps engineers visualise and analyse the proportions of solids, water, and air within a soil mass. By studying the relationships among these three components, engineers can determine essential soil properties such as density, porosity, degree of saturation, and unit weight, which directly influence the strength and stability of structures built on it.
1. Composition of Soil
A typical soil mass consists of three distinct constituents:
Solids (Vs) – These are mineral or organic particles that form the framework of soil.
Water (Vw) – Occupies some or all of the void spaces between soil grains.
Air (Va) – Fills the remaining voids not occupied by water.
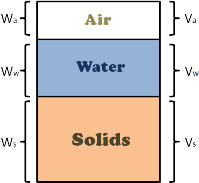
These components coexist within the soil structure, influencing its mechanical and hydraulic behaviour. The total soil volume (V) and total weight (W) can be represented as:
V = Vs + Vw + Va
W = Ws + Ww
Since the weight of air (Wa) is negligible, it is usually ignored in calculations.
2. What is a Soil Phase Diagram?
A soil phase diagram is a graphical representation showing the relative proportions of solids, water, and air in a given soil sample. It provides a visual framework to understand and calculate various relationships between these phases.
There are three main types of soil phase diagrams:
Three-Phase Diagram – for partially saturated soils.
Two-Phase Diagram (Saturated Soil) – when all voids are filled with water.
Two-Phase Diagram (Dry Soil) – when all voids are filled with air.
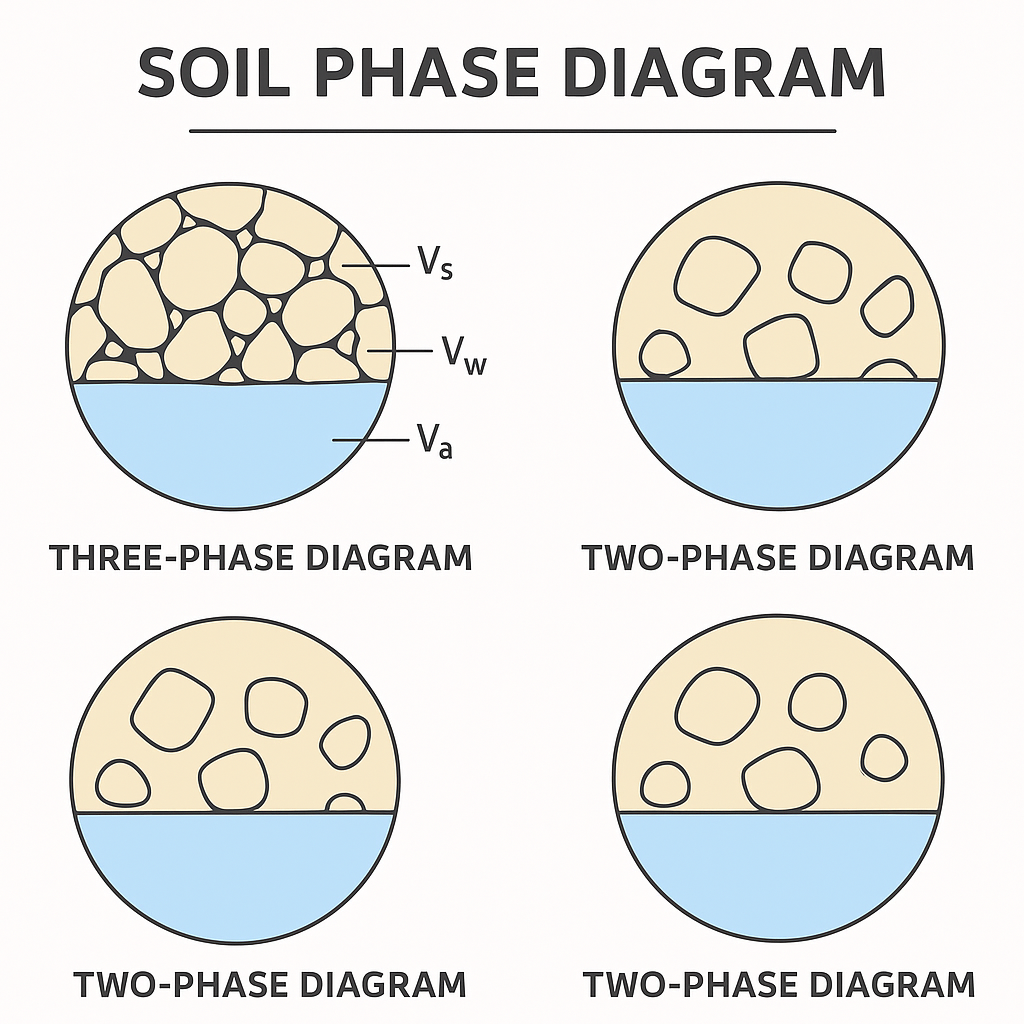
Below are labelled illustrations that help visualise these relationships:
Three-Phase Diagram (Partially Saturated Soil)
In a partially saturated soil:
Voids are partly filled with water and partly with air.
The soil mass has three distinct phases: solids, water, and air.
This is the most common condition of natural soils encountered in the field.
Two-Phase Diagram (Saturated Soil)
In saturated soils, all voids are completely filled with water, leaving no air.
Thus, the soil consists of only two phases: solids and water.
This condition occurs below the groundwater table or in clayey soils after prolonged rainfall.
Two-Phase Diagram (Dry Soil)
In completely dry soils, all voids are filled with air, and no water is present.
Such conditions are typical in dry sand or during prolonged droughts.
3. Soil Phases and Relationships
The relationships among the different soil phases form the basis for most soil mechanics calculations. Key terms include:
(a) Total Volume (V)
The total space occupied by the soil mass:
V = Vs + Vv
where (Vv) (volume of voids) = (Vw + Va)
(b) Void Ratio (e)
The ratio of the volume of voids to the volume of solids:
e = Vv/Vs
It represents how porous or compact a soil is. A higher void ratio indicates looser soil.
(c) Porosity (n)
The percentage of the total soil volume that is void space:
n = Vv/V * 100
(d) Degree of Saturation (S)
The ratio of the volume of water to the volume of voids:
S = Vw/Vv * 100
1. For dry soil, (S = 0%)
2. For saturated soil, (S = 100%)
3. For partially saturated soil, (0 < S < 100)
(e) Air Content (a)
The fraction of void space filled with air:
a = Va/{Vv
Thus, (a + S = 1)
4. Weight Relationships in Soil
Weight relationships are equally important for evaluating soil strength and stability.
(a) Bulk Unit Weight (γ)
The total weight of the soil mass per unit volume:
γ = W/V = Ws + Ww/V
(b) Dry Unit Weight (γd)
The weight of solids only per unit total volume:
γd = Ws/V
(c) Saturated Unit Weight (γ{sat})
When soil is fully saturated:
γ{sat} = W_s + Ww/V
(d) Submerged Unit Weight (γ′)
When soil is below the water table, its effective weight is reduced due to buoyancy:
γ′ = γ_{sat} – γw
where (γw) = unit weight of water.
5. Significance of Soil Phase Diagrams in Civil Engineering
Understanding the soil phase diagram is essential for several reasons:
Foundation Design:
Engineers must know soil density, porosity, and saturation to design foundations that minimise settlement and bearing failure.
Earthwork and Compaction:
Phase diagrams help determine the optimum moisture content and maximum dry density during compaction tests, ensuring strong, stable embankments.
Slope Stability:
Degree of saturation affects pore-water pressure, a key factor influencing slope failure and landslides.
Groundwater and Drainage Design:
Knowledge of saturated and dry conditions aids in designing drainage systems, dewatering plans, and flood control measures.
Soil Classification and Testing:
Soil engineers use parameters derived from phase diagrams (e.g., void ratio, unit weight) for laboratory and field test analysis such as the Standard Proctor Test, Atterberg Limits, and Consolidation Test.
6. Practical Example
Let’s consider a simple case:
A soil sample has:
Vs = 0.03 m³
Vw = 0.01, m^3
Va = 0.005, m^3
Then:
V = 0.03 + 0.01 + 0.005 = 0.045 , m^3
The void ratio (e) is:
e = Vv/Vs = 0.015/0.03 = 0.5
The degree of saturation (S) is:
S = Vw/Vv * 100 = 0.01/0.015* 100 = 66.7%
Thus, the soil is partially saturated, a common state for natural soils in the field.
7. Conclusion
The soil phase diagram provides the conceptual foundation for understanding soil composition and behaviour in engineering contexts. Whether designing highways, bridges, or buildings, civil engineers rely on these diagrams to determine critical soil parameters and ensure structural stability.
By analysing the proportions of solids, water, and air, one can predict how a soil will respond to loading, drainage, and environmental changes—making the phase diagram an indispensable tool in soil mechanics and geotechnical engineering.